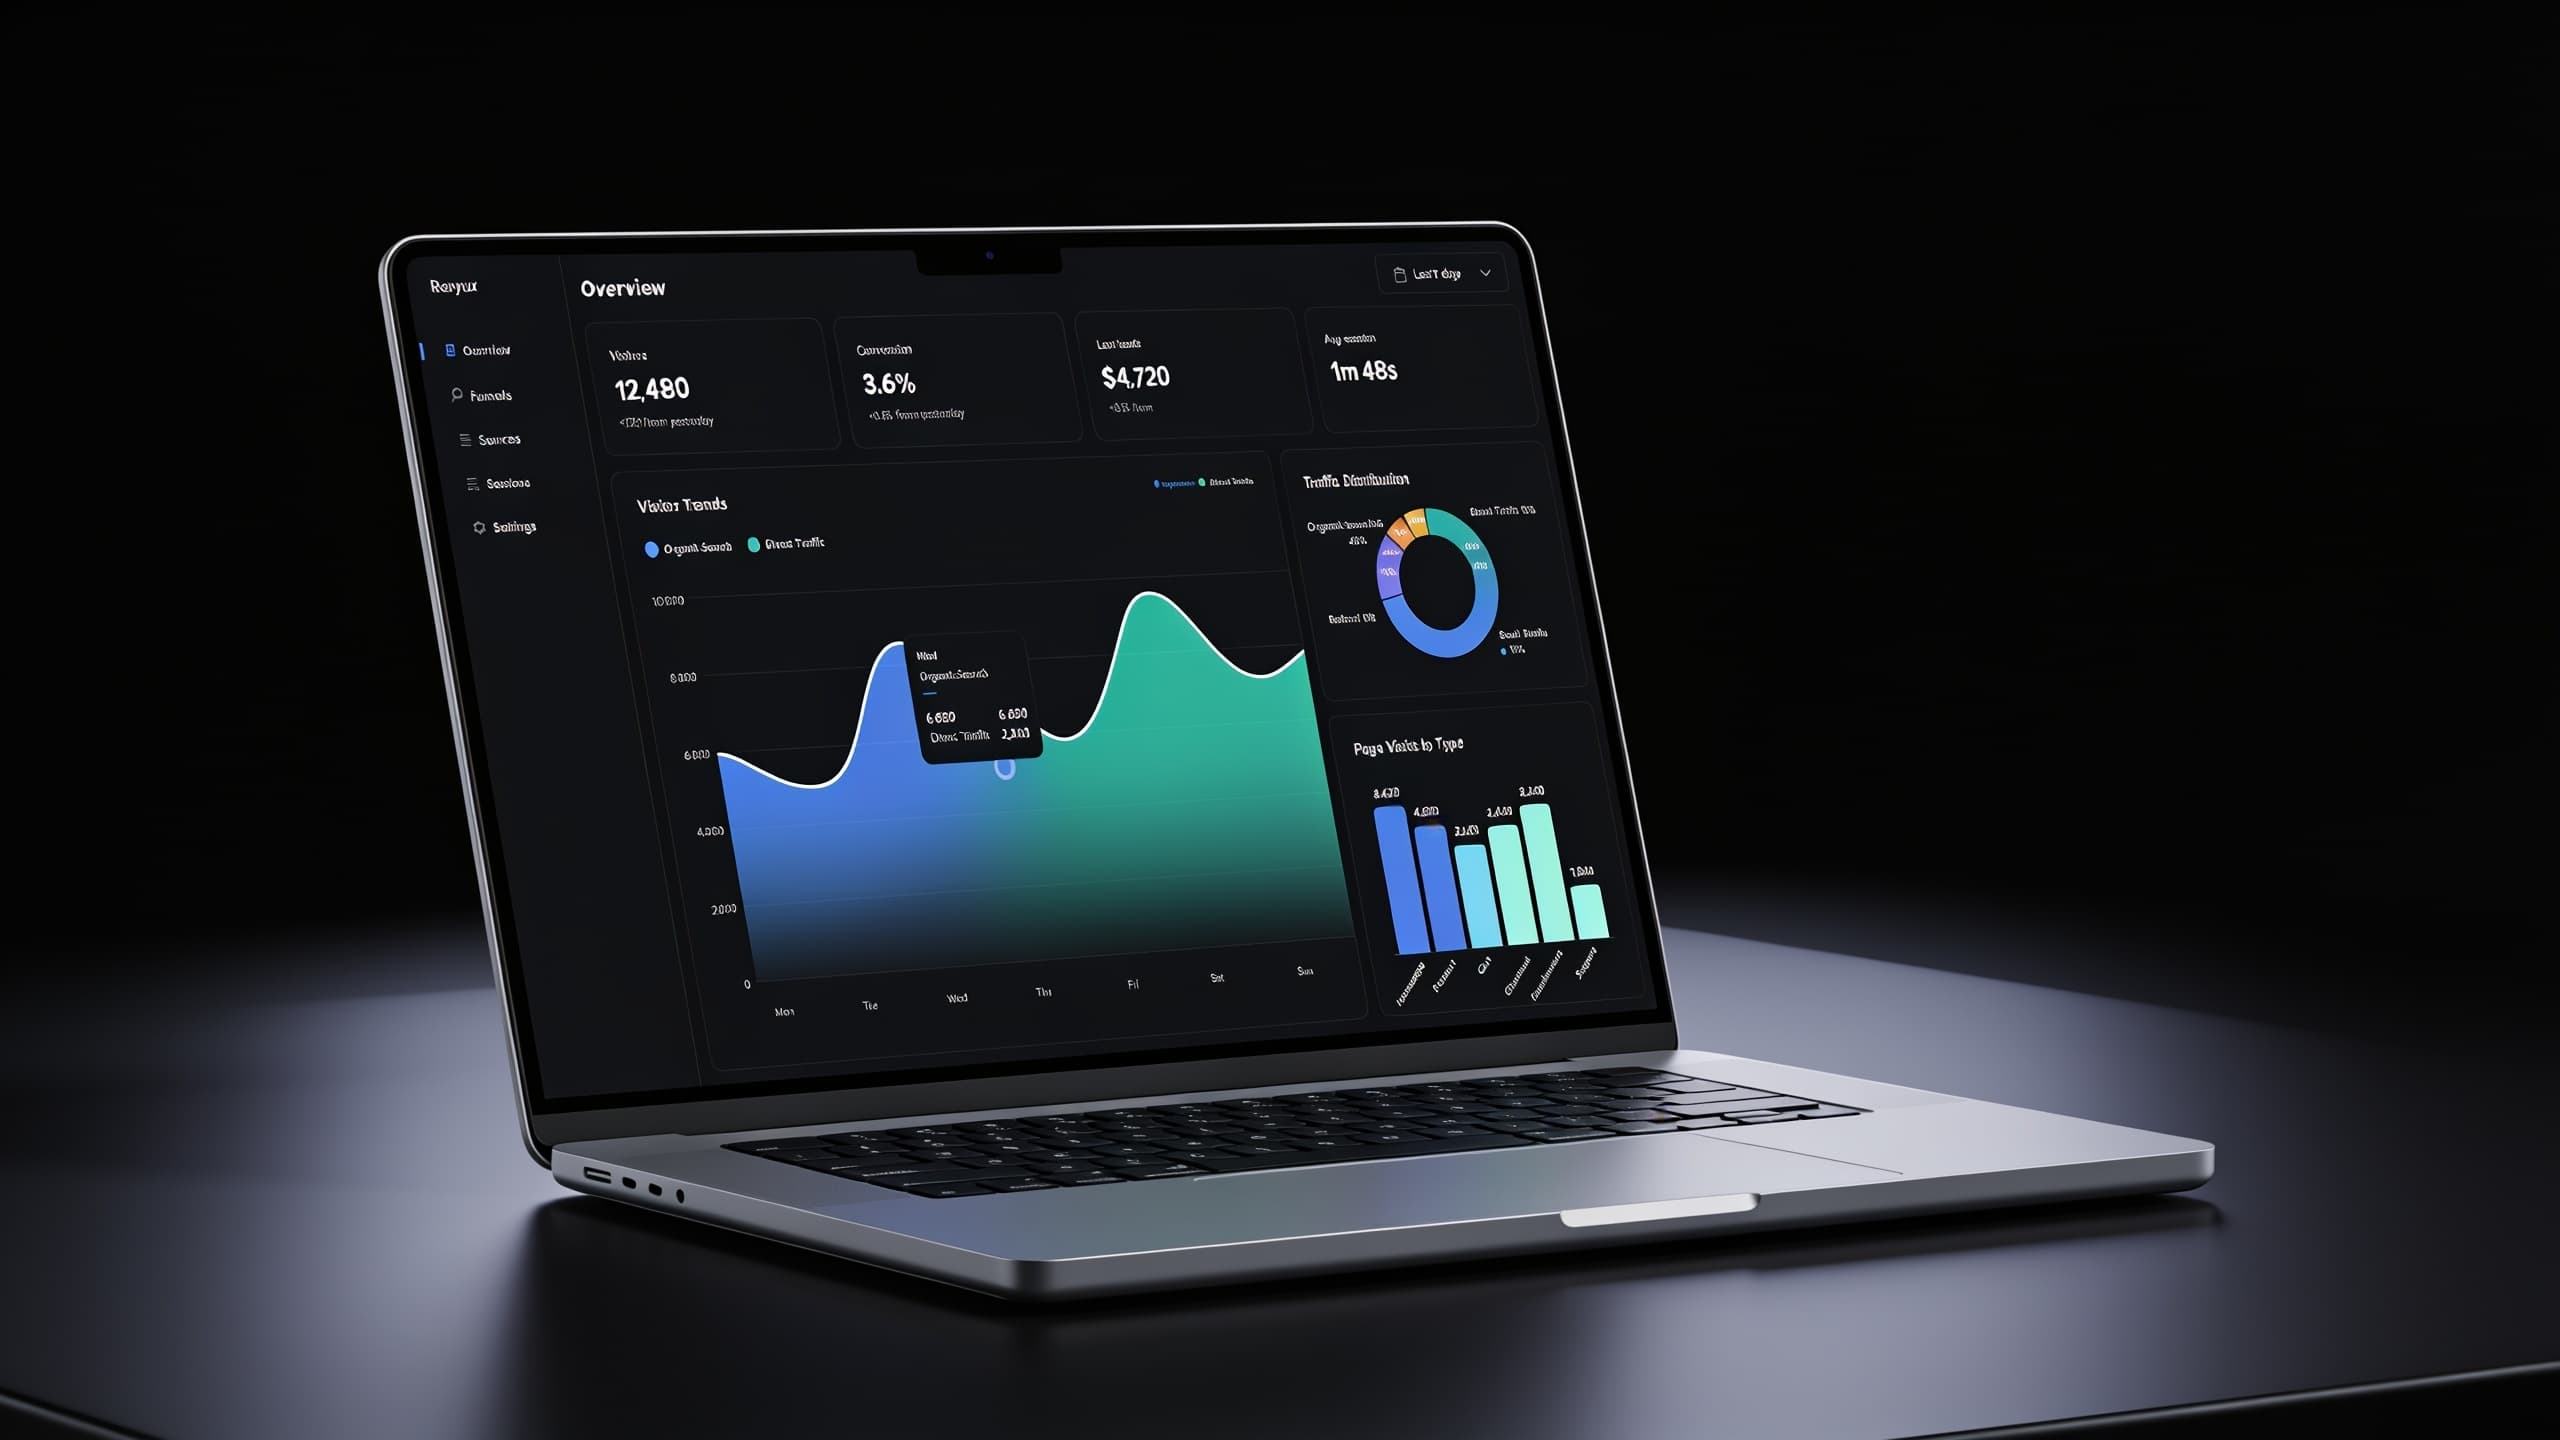
Diagnosis, not dashboards
Revyux reads your sessions and writes the reason people leave in plain English, ranked by how many leads each fix wins back.
Plain-language conversion analytics
Revyux watches your funnel and explains, in plain words, why visitors don't convert and what to fix tonight.

Drops into any site or framework. One script tag, no SDK.


Most analytics tools bury the answer under dashboards, filters, and funnels you have to read like tea leaves. Revyux reads them for you, then names the one place you are losing people and the fix that moves the number.
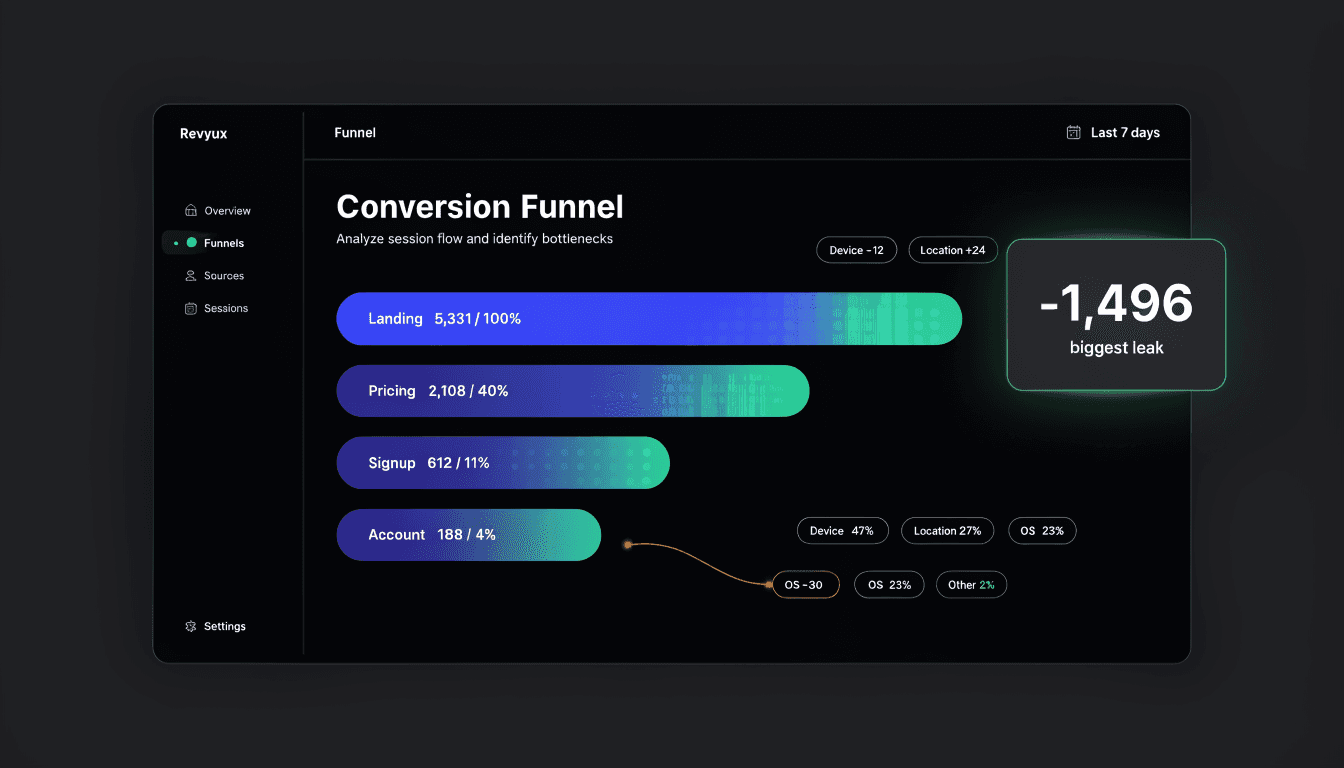
Revyux rebuilds your funnel from raw sessions and shows the exact step where people quit. No setup, no tagging.
looked at pricing and left without starting signup. The biggest single leak in this funnel, and the first thing Revyux flags.
Sample project, illustrative numbers.
Inside Revyux
One dark, quiet dashboard. No chart soup, no setup. Just the four screens that tell you what is working and what to fix.
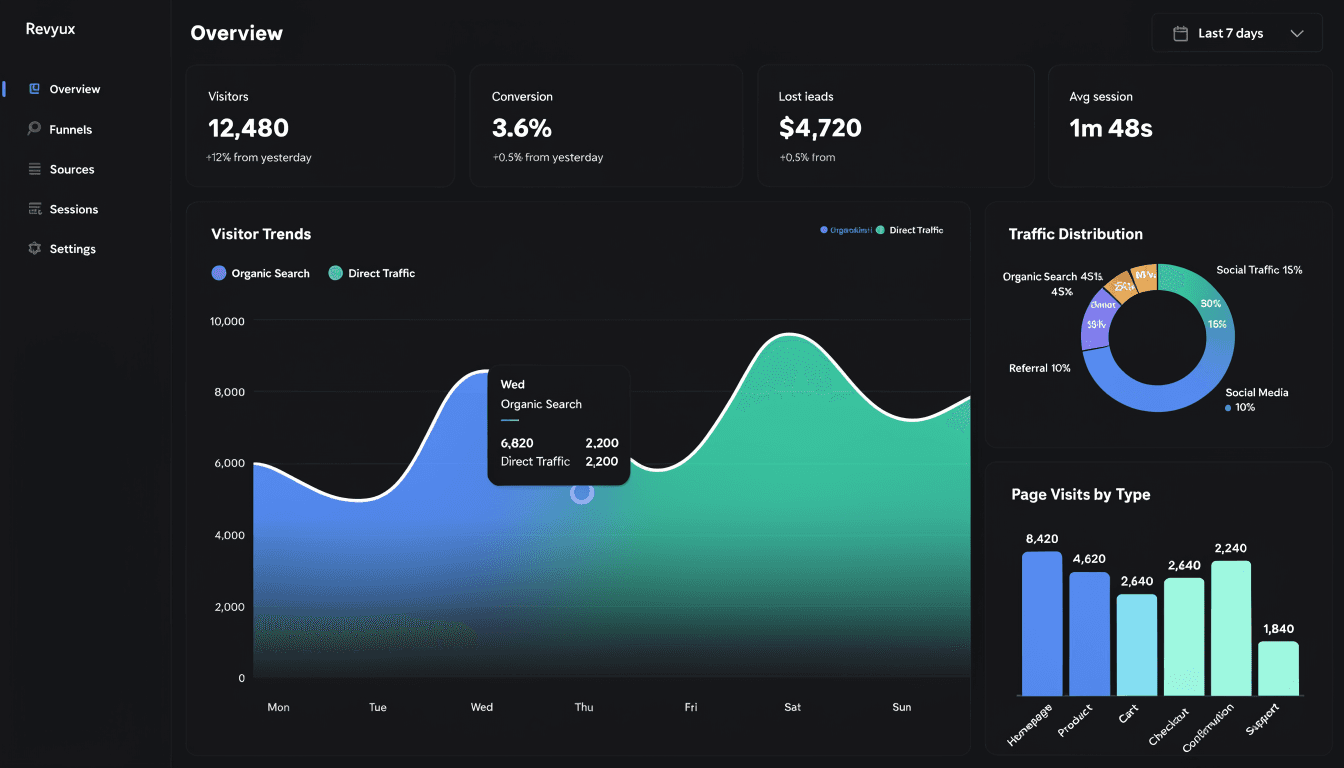
Overview
Traffic, conversion, and the leads you are losing, in one glance.
Funnel
The exact step where visitors quit, rebuilt from raw sessions.
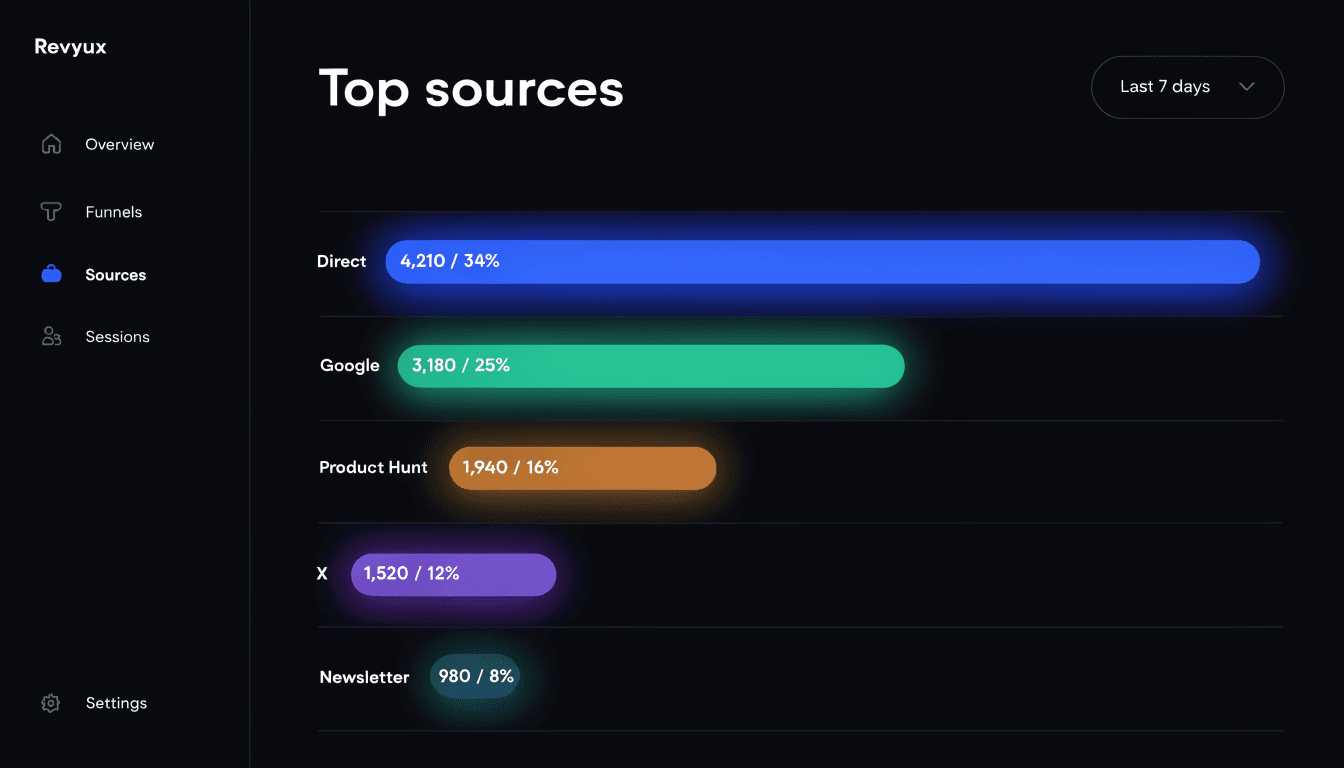
Sources
Where your visitors come from, ranked by what converts.
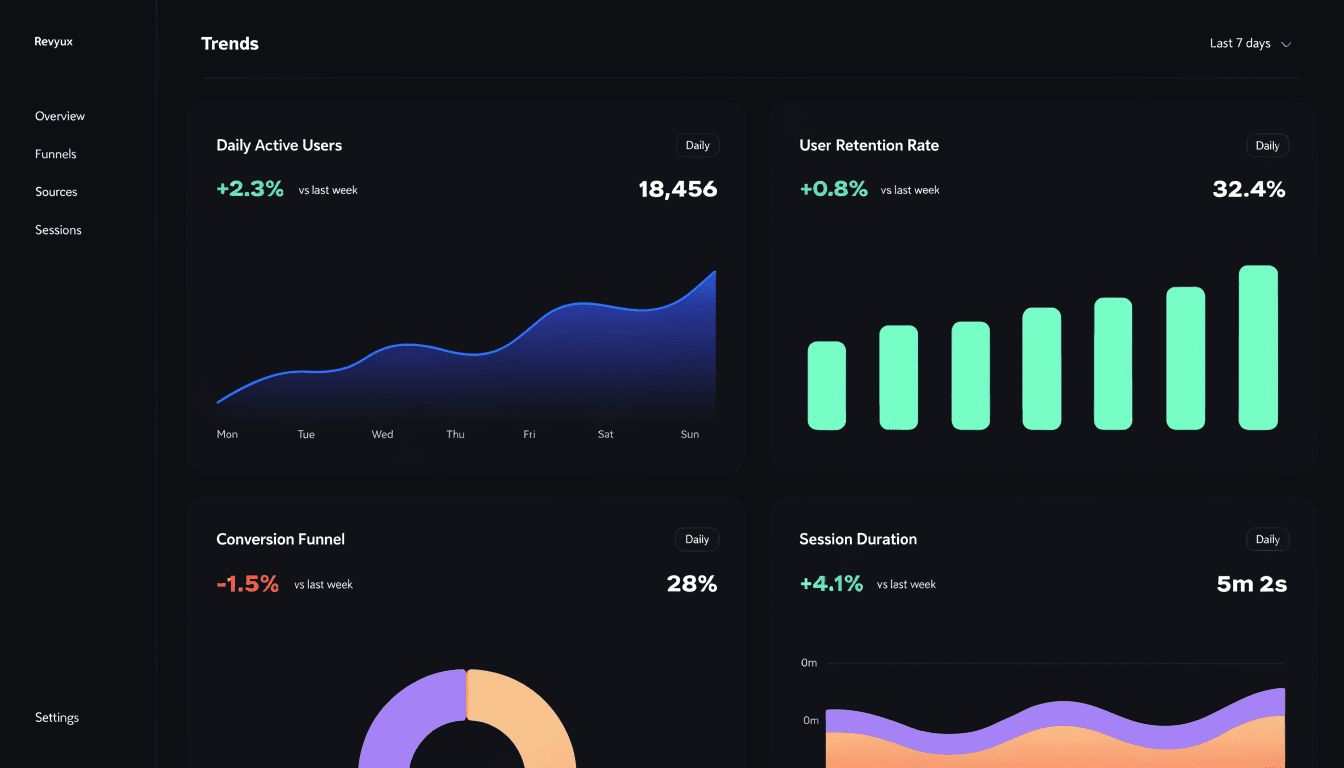
Trends
How every metric moves, week over week.
Analytics should not cost your visitors their privacy. Revyux is built to measure what people do without collecting who they are.
No cookie banners, no fingerprinting. A few kilobytes of script that respect Do Not Track.
Revyux records behavior, not identities. Visitors stay anonymized and stray emails are stripped out server-side.
Never sold, never shared with third parties. Export it or delete it whenever you want.
The toolkit
Revyux reads your sessions and writes the reason people leave in plain English, ranked by how many leads each fix wins back.
Tiny, cookie-free, and SPA-aware. Paste it once and you are collecting sessions.
Pick a goal. Revyux assembles the funnel from real sessions and finds the step that bleeds.
Geo, device, scroll depth, clicks, and form drop-off, captured automatically with no extra code.
Set an average lead value and Revyux turns drop-off into the revenue you left on the table.
One email with what changed, what broke, and the fix worth shipping first.
The diagnosis
Every diagnosis names the bottleneck, then lists fixes ranked by the leads each one recovers. What, where, and exactly how.
“Your funnel is healthy until pricing. Two fixable things quietly cost you about 24 leads a week.”
Sample diagnosis, illustrative numbers.
<script
  defer
  src="https://cdn.revyux.com/t.js"
  data-api-key="rvx_live_8f2c...d41a">
</script>Paste one script tag into your site. No SDK, no tag manager, no data team. That is the whole setup.
Revyux records sessions, scroll depth, clicks, and form drop-off as people move through your pages.
After a day of traffic, open your dashboard to a ranked list of fixes, each one written in plain words.
The old way
With Revyux

“Revyux named the exact field people were quitting on, and told us exactly how to fix it.”
Watch one site and see the whole funnel.
Get the reason people leave and the fix that pays.
Shared workspaces and the controls bigger teams need.